The notes below are a summary of the key points needed for the exam. For more details and background they should be read in conjunction with the additional reading:
In Lecture 2 we introduced the point spread function (PSF) of a microscope. We found that, for a microscope objective with a circular aperture, the PSF is an Airy pattern (a Bessel function). When we did this we were implicitly working at the focal plane of the microscope. As we move away from the focal plane, the PSF widens (or, equivalently, the MTF narrows) and so the resolution drops.
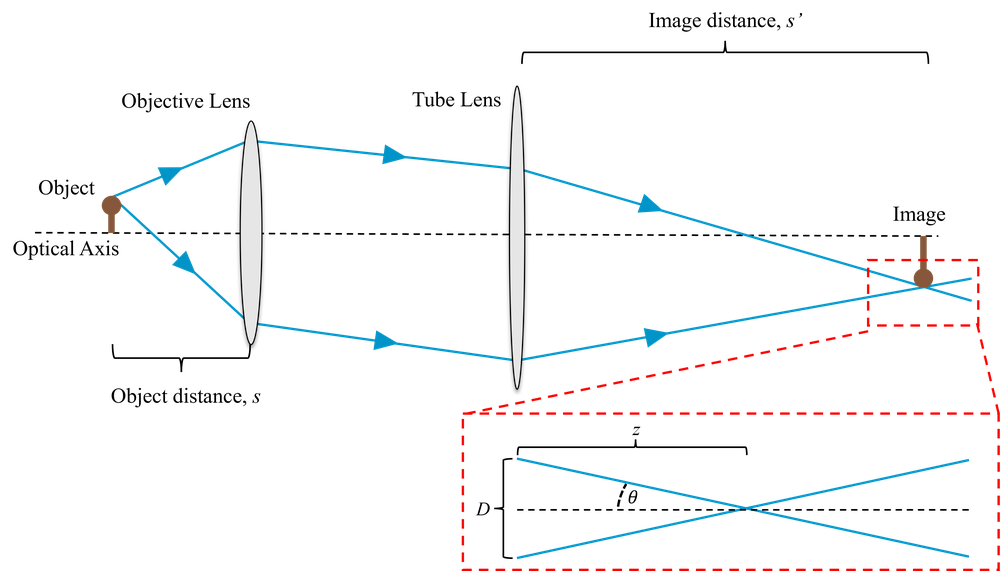
A full description of this can be derived from scalar diffraction theory which we will not cover. Far from focus we can approximate the effect with simple geometrical optics, as shown in Fig. 1. Recalling that \(\mathrm{NA} = \sin\theta\), this suggests that the diameter of the PSF should be on the order of \(D\approx2z\mathrm{NA}\) where \(z\) is the defocus. This is increasingly incorrect as we get close to the focus. However, it’s sufficient to show us that the higher the NA, the quicker the PSF broadens as we move away from the focus.

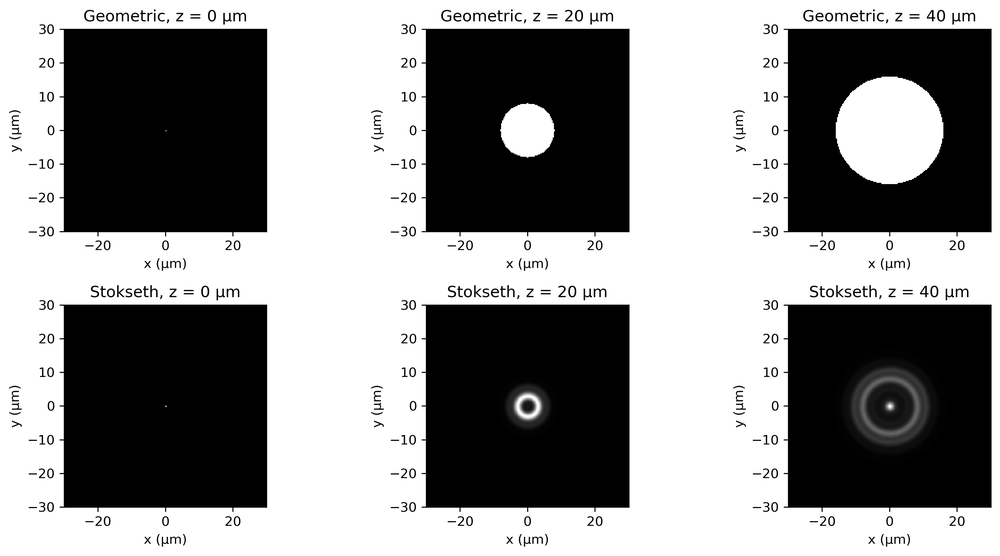
A more accurate way of estimating the change in the PSF with defocus is through Stokseth’s approximation (which you do not need to know). Fig. 2 shows the geometric and Stokseth’s approximation of the PSF for an objective of NA = 0.2.
The depth of focus is the distance from focus over which the PSF does not widen significantly. It is often defined by the Rayleigh range, which is the distance from focus where the spot size increases by \(\sqrt{2}\) (and so the area doubles). We can then define the depth of focus as twice this range. For low NAs, assuming a Gaussian beam, the depth of focus, \(R\), is given by,
\[\begin{equation} R = \frac{n\lambda}{NA^2}, \end{equation}\]
where \(n\) is the refractive index of the medium. This is not strictly valid for high NAs as used in microscopy, but will give the correct order of magnitude. In any case, high NA objectives will have a shorter depth of field. Note that the depth of field depends on the inverse square of the NA, whereas the resolution (by any definition) depends inversely on NA. (This is particularly fortuitous for many reasons, including for OCT!)
However, just because an object is out of focus, it does not mean we don’t collect light from it. This can be seen simply from conservation of energy - the same intensity of light reaches each depth, and so we expect the same total signal back. The effect when we image thick tissue is that the in-focus image is super-imposed with out-of-focus images from all the other planes in the sample. This serves to reduce image contrast and resolution. In conventional microscopy this makes it necessary to slice tissue into thin layers before imaging.
The aim of optical sectioning in microscopy is to allow imaging of thick objects (under epi illumination) by selecting only the light (or image information) from the in-focus layer. Using the methods we discuss in this lecture we will rely on the 3D point spread function to achieve this, and so our optical sectioning strength or axial resolution (i.e. the thickness of the optical section) is limited to the order of the depth of focus. Alternative approaches, such as optical coherence tomography, use a different approach based on interferometry, in which case that limit is not imposed.
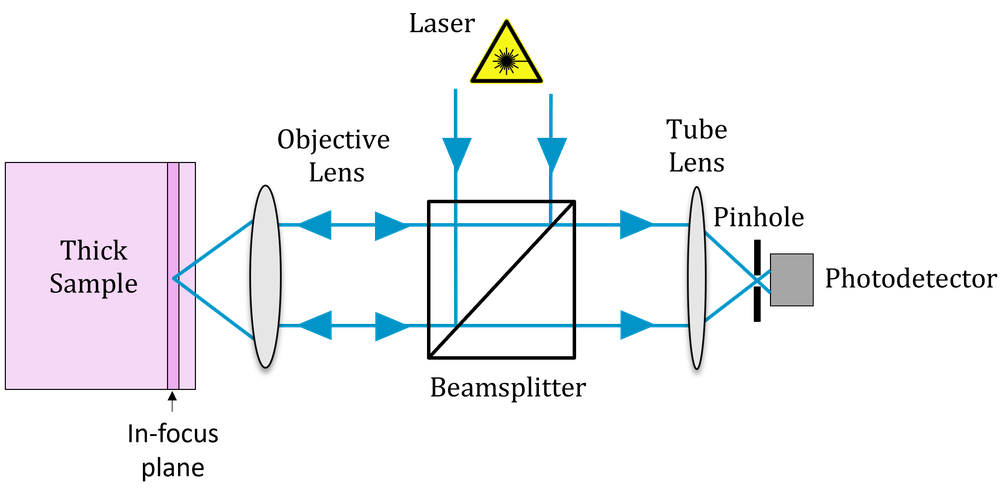
In confocal microscopy, the microscope is designed in such a way that light emitted from a region away from the focal plane is physically blocked by a pinhole. The basic idea is shown in Fig 3. Rather than illuminating the whole of the sample, we focus light onto a single point. In order to do this, we need to use a laser. This point is then imaged onto the pinhole, so that only light from the in-focus plane passes through. To generate an image we then need to scan this point around in two dimensions (or move the sample, which is physically equivalent but generally less convenient).
Confocal microscopy is almost always operated under
epi-illumination, the same objective is used both for
illumination and imaging. A pair of x-y scanning mirrors are used to
scan the imaged point in 2D. The collected light retraces the path and
so is de-scanned by the mirrors before being pulled off onto the
pinhole. Behind the pinhole there is a photodetector, and an image is
built up by measuring the intensity of light passing through the pinhole
for each point on the sample. You can see various configurations of
confocal microscopes at:
Confocal
Concepts.
If we consider a plane away from focus, the area of the PSF scales roughly quadratically with the defocus. Hence, when this defocused PSF is imaged onto the pinhole, the amount of light reaching the detector will fall quadratically. Fig. 4 shows an example plot of this for a microscope of 0.2 NA at 500 nm wavelength for an infinitesimal pinhole and a 1 AU pinhole. We see that only light from near the focus plane reaches the detector with any significant intensity. Hence the optical sectioning effect we described above.
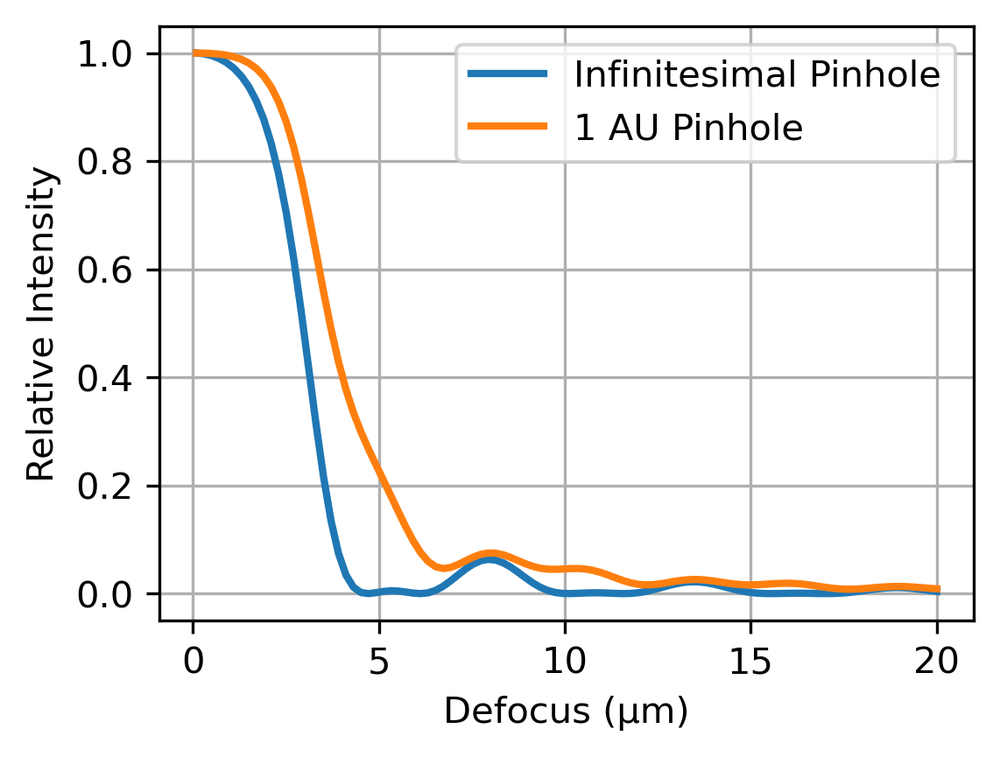
The highest axial spatial frequency that can be transmitted is,
\[\begin{equation} d_{\mathrm{axial,SF}}=\frac{n\lambda}{2\mathrm{NA}^2}. \end{equation}\]
But, as discussed previously, limiting spatial frequency is not usually a good way to define resolution. We can define the axial resolution (the width of the optical section) as the full width half maximum of this drop-off curve. While there are different definitions of the axial resolution, the best case is on the order of,
\[\begin{equation} d_{\mathrm{axial,FWHM}}=\frac{0.64\lambda}{n-\sqrt{n-\mathrm{NA}^2}}, \end{equation}\]
where \(n\) is the refractive index. We say ‘best’ because the achieved axial resolution depends on the pinhole size, the larger the pinhole the more out-of-focus light reaches the detector. However, sometime we need more light to achieve an image with a reasonable signal level, and so pinhole size has to be optimised. Microscopes will often come with a selection of pinholes mounted on a rotating stage, so that the best pinhole for a particular imaging application can be selected.
In Lecture 2 we determined the point spread function and (and so the resolution) of a microscope which was imaging a uniformly-illuminated system. We call this widefield illumination, and hence define this PSF as the widefield PSF, \(PSF_{widefield}\).
In a confocal microscope, we illuminate only a single point on the tissue at any time. Therefore, we do not need any resolution in our detection system at all - we know that all the light comes from the point we have illuminated. Of course, we cannot illuminate an arbitrarily small point, we are limited by the numerical aperture of the objective. You can think of this as though we are imaging a point at infinity onto the sample. Optics is reciprocal (invariant to a change in direction) and so we are limited by the same spatial frequency cut-off and hence point spread function as when we are imaging the sample onto a camera. So the illumination point is (ideally) an Airy pattern, with the radius of first minimum,
\[\begin{equation} d=0.61 \frac{\lambda}{\mathrm{NA},} \end{equation}\]
and a full width half maximum of (FWHM),
\[\begin{equation} d_{\mathrm{FWHM}}=0.51 \frac{\lambda}{\mathrm{NA}}. \end{equation}\]
So, at first glance, the resolution is exactly the same as a conventional microscope with widefield illumination. However, we also have to take account of the fact that we then image this point onto a pinhole. The resulting PSF then has to be multiplied by an image of the pinhole (as imaged onto the sample plane). Of course the image of the pinhole at the sample plane (or the sample plane at the pinhole) is also affected by the PSF, so we need to convolve the pinhole function with the detection PSF. Hence, the resulting total PSF is,
\[\begin{equation} \mathrm{PSF_{confocal} = PSF_{illumination} \times (PSF_{detection}} \ast H_{\mathrm{pinhole}}). \end{equation}\]
Here, \(H\) is a function which defines the pinhole. In 2D space, it is a circle with \(1\) for the hole and \(0\) for the barrier. For a very small pinhole, \(H\) tends to a delta function. If we illuminate and collect with the same objective then, ignoring any Stoke’s shift in fluorescence imaging, \(\mathrm{PSF_{illumination} = PSF_{detection} = PSF_{widefield}}\). We can see then that for an infinitesimally small pinhole, our PSF is now the square of the PSF of widefield microscope,
\[\begin{equation} \mathrm{PSF_{confocal} = (PSF_{widefield})^2 }. \end{equation}\]
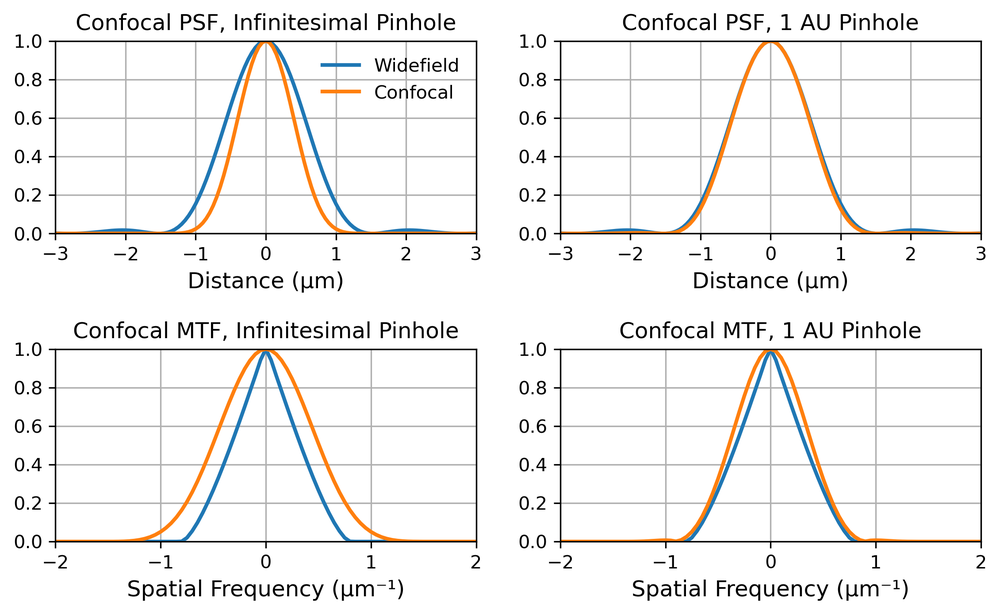
The position of the minimum doesn’t change, but the central lobe (the airy disc) is now narrower. If we square the airy pattern the full width half maximum reduces by about 40%, as can be seen in the top left pane of Fig. 5. From Fourier theory, this means that the MTF is also wider, the confocal MTF is the autocorrelation of the widefield MTF. We therefore increase the spatial frequency support by a factor of 2. However, the MTF at these high spatial frequencies is low, and so we do not really double the effective resolution. So depending on the definition of resolution we have anything between no change from widefield (first minimum of PSF) and double the resolution (Abbe spatial frequency cut-off limit). In practice, the 40% improvement in PSF FWHM is usually quoted.
Unfortunately, this assumes an infinitesimally small pinhole, which would also let through an infinitesimally small amount of light. For practical purposes, we almost always want a pinhole which is at least as wide as the first minimum of the Airy pattern. (We sometime refer to this size as one Airy Unit (AU), not to be confused of course with the AU distance from Astronomy). The PSF and MTF of a confocal microscope for infinitesimal and 1AU pinholes are shown in Fig 5. We can see that, for a pinhole of 1 AU, the resolution improvement is almost negligible. So we generally use confocal microscopy because it provides optical sectioning, and not because it improves lateral resolution.
Confocal microscopy requires a laser (or multiple lasers), high speed scanning mirrors, and one or more photodetectors. This makes it relatively expensive and requires a complete redesign of the microscope. Even then the frame rate is not usually higher than 20 Hz.
Confocal microscopy can image with the focal plane at most a few hundred microns deep into the tissue. This is because photons from out-of-focus planes may be scattered one or more times, and may end up passing through the pinhole anyway, contributing to noise. As we get deeper into the tissue, the chance of any photon making it back out without being scattered drops exponentially. Similarly, photons from the in-focus plane, are more likely to be scattered so that they miss the pinhole, reducing the signal. Eventually we reach the point where almost all photons are scattered and our signal-to-noise ratio drops below a useful level.
An alternative technique to confocal microscopy is structured illumination (SI). (This should not be confused with various other techniques called structured illumination, including a super-resolution technique which we will discuss in Lecture 5). SI has the advantage that it does not require a laser and the image is produced on a camera. This generally makes it cheaper and easier to retrofit onto existing non-confocal microscopes.
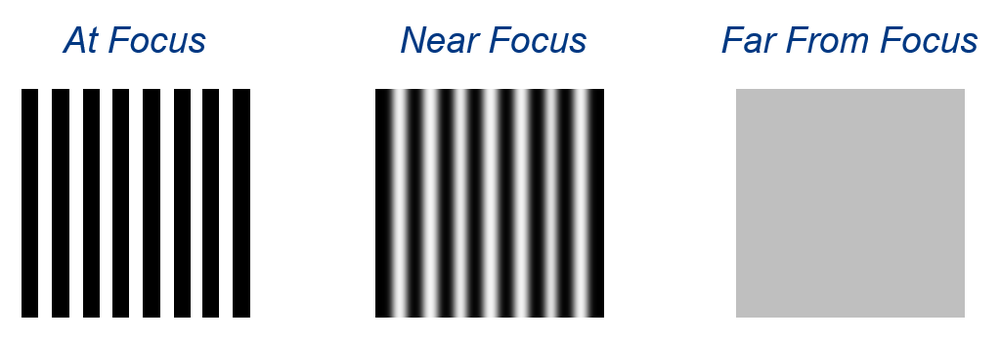
The idea is to image a sinusoidal pattern onto the sample, usually by imaging a grating onto it. Of course the image of the grating on the sample depends on the PSF. At focus we will obtain a high fidelity reconstruction (assuming the spatial frequency is not too high) while away from focus the pattern will be blurred. This means that the in-focus part of the image is spatially modulated while the out-of-focus part is not. We therefore need only select the modulated part of the image in order to obtain optical sectioning.
The most robust way to demodulate a signal such as this is called ‘three phase demodulation’, in which we acquire three images with the illumination pattern shifted by a third of the pattern pitch between each. For each pixel of the image, the demodulated signal is,
\[\begin{equation} I_{\mathrm{SIM}} = \sqrt{(I_2 - I_1)^2 + (I_3-I_2)^2 + (I_1 - I_3)^2}. \end{equation}\]
Intuitively, it can be seen that any unmodulated signal (from an out-of-focus layer), which will be the same for all three images, will simply cancel out due to the subtractions. If we calculated \(I_{SI}\) for each pixel, we therefore obtain an optically sectioned image.
To simulate an image that was created with widefield illumination, we can simply add the three images together, as the sum of three sine waves which are each 120 degrees out of phase is a constant,
\[\begin{equation} I_{\mathrm{widefield}} = I_1 + I_2 + I_3. \end{equation}\]
To acquire the three phase-stepped images we need to shift the grating by the correct distance between successive acquisition of image frames. Alternatively, the patterns can be generated by some type of spatial light modulator to avoid mechanical instabilities. In practice, square wave patterns are used rather than sine waves as it is harder to make a sinusoidal grating. Providing the spatial frequency is high enough, the PSF will result in a sinusoid at the sample plane (think of the Fourier transform of a square wave if this isn’t clear - the higher frequencies necessary to generate the sharp of edges of the ‘square’ will be cut off).
Theoretically, the axial sectioning strength of SI microscopy can be better than confocal microscopy if we illuminate with a pattern which is right at the spatial frequency cut-off. However, at this point the modulation depth of the pattern will also be low (think how low the MTF is near the cut-off) and so the image contrast will be poor. In practice, therefore, a sensible trade-off between axial resolution and contrast-to-noise ratio is required.
Whereas confocal microscopy physically blocks light from out-of-focus planes, in SI microscopy we collect the light but then digitally subtract it. This means we also collect all the noise (when we subtract one signal from another the noise still adds in quadrature). So SI is inherently a noisier technique and cannot be used anywhere near as deep into tissue as confocal. For moving objects it is also very sensitive to motion artefacts, there can essentially be no motion between acquisition of the three successive frames (although for interest you may want to look at this paper from my lab, where we try to address this problem for endoscopic SI Microscopy). Any mechanical variation in the generation of the three patterns may also lead to artefacts.
While confocal microscopy is by far the most common way of achieving optical sectioning in microscopy, there are various other techniques which you may want to look into for interest only.
Spinning Disk Confocal uses a disk with a pattern of holes in it rather than scanning a laser beam. This can be spun very fast, leading to higher frame rates, and the image can be formed directly onto a camera, although there are trade-offs in light throughout versus optical sectioning strength. (See this page for more details). Another way of doing confocal microscopy is to focus a line of light onto the sample, and image this through a slit rather than a pinhole. The optical sectioning effect isn’t as strong, but a line can be scanned in 1D much faster than a point can be scanned in 2D. I have previously done some work applying this to endoscopic microscopy (see for example this paper).
In light sheet microscopy we illuminate the sample from the side (or some oblique angle) with a planar sheet of light (this can be done with a cylindrical lens and an objective). If we align this light sheet with the focal plane of the microscope then only the focal plane will be illuminated, and so when we form an image on the camera we have immediate optical sectioning. This is a simple and fast way of achieving sectioning, with particular applications in monitoring dynamic processes. It also minimises photo-damage since only the plane actually being imaged is illuminated, but it doesn’t work well for thick, highly scattering samples where the planar illumination beam will be highly scattered. A variant of light-sheet using a scanned pencil beam rather than a light sheet reduces scattering and improves sectioning in practice, although loses some of the simplicity of light-sheet. Other problems are associated with striping artefacts due to absorption of the excitation light sheet, these can be tackled with multi-view or multi-angle approaches, where the angle of the illumination beams is varied and artefact-free images synthesis from multiple acquisitions.
This section is non-examinable, but you can read a
review at:
http://iopscience.iop.org/article/10.1088/2040-8986/aab58a
In two photon microscopy, optical sectioning occurs because two photon excitation rates depend quadratically on light intensity, and so essentially only occur at the focus of a scanning laser beam. This avoids the need for a detection pinhole (we can collect all the fluorescence and we know it has come from the focal plane) and so decreases sensitivity to scattering. Combined with the generally better penetration of higher wavelengths used for two photon excitation, this increases the maximum imaging depth significantly, to over 1 mm in some cases. The downside is the need for expensive high-power pulsed lasers to overcome the small probability of two photon excitation occurring.
This section is non-examinable, but you can read a review at:
https://www.ncbi.nlm.nih.gov/pmc/articles/PMC3846297/
You should be able to:
Explain how the PSF and MTF change away from the focal plane.
Explain what is meant by depth of focus and explain what determines it.
Explain the need for optical sectioning in microscopy.
Explain the basic principles of confocal microscopy.
Compare axial and lateral resolution in confocal and widefield microscopy.
Explain the limitations of confocal microscopy.
Explain the principles of structured illumination for optical sectioning.
Explain the limitations of structured illumination for optical sectioning.